Configurations
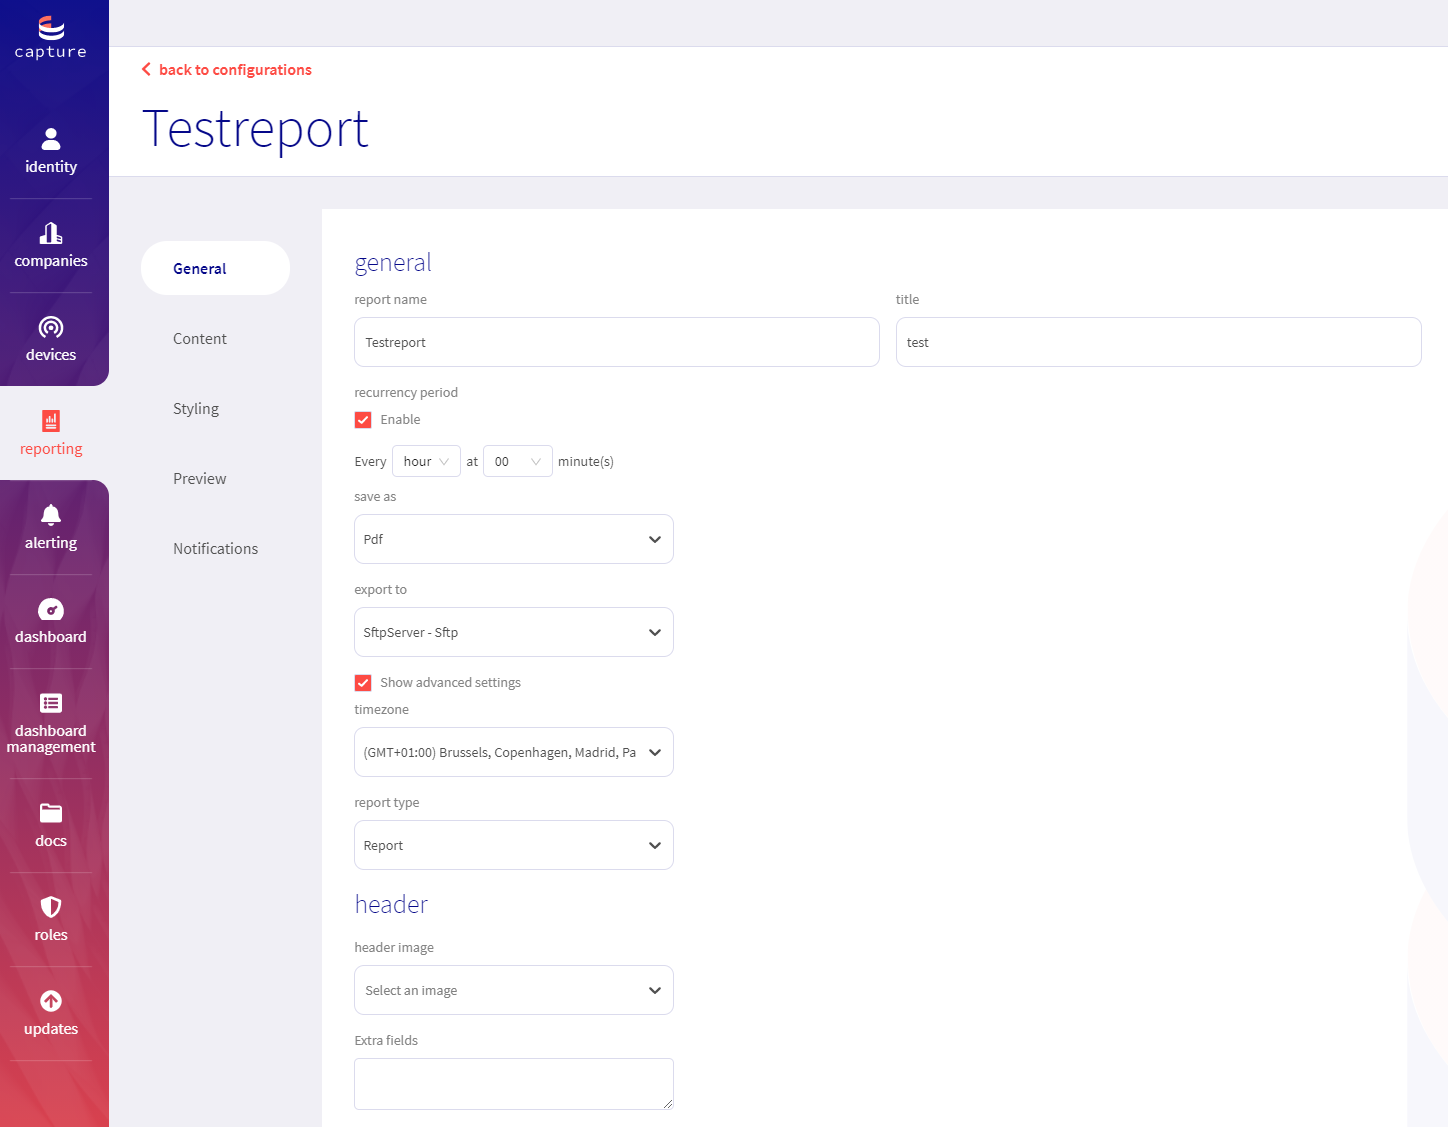
General settings
| Field | Function |
|---|---|
| report name | Name for the config |
| title | Title of the report |
| reccurency period | Generate a report on a periodical base |
| save as | Save the report as a pdf or csv file |
| export to | export the report to Capture or one of your external file locations |
| show advanced settings | Shows extra advanced settings |
| header image | Images used as a report header (see Image pages) |
| extra field | Adds an extra field in the report header |
Timezone
The timezone setting can be used when having a recurrency period enabled. This makes sure the schedule and report time is correct for your timezone. 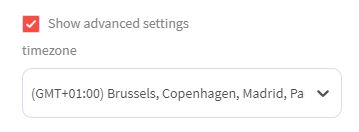
Retention policy
Under the timezone dropdown, the retention policy of the report can be specified. This specifies how long the report will be stored. After this period, Capture will auto delete your report. The default value is 30d.
Content
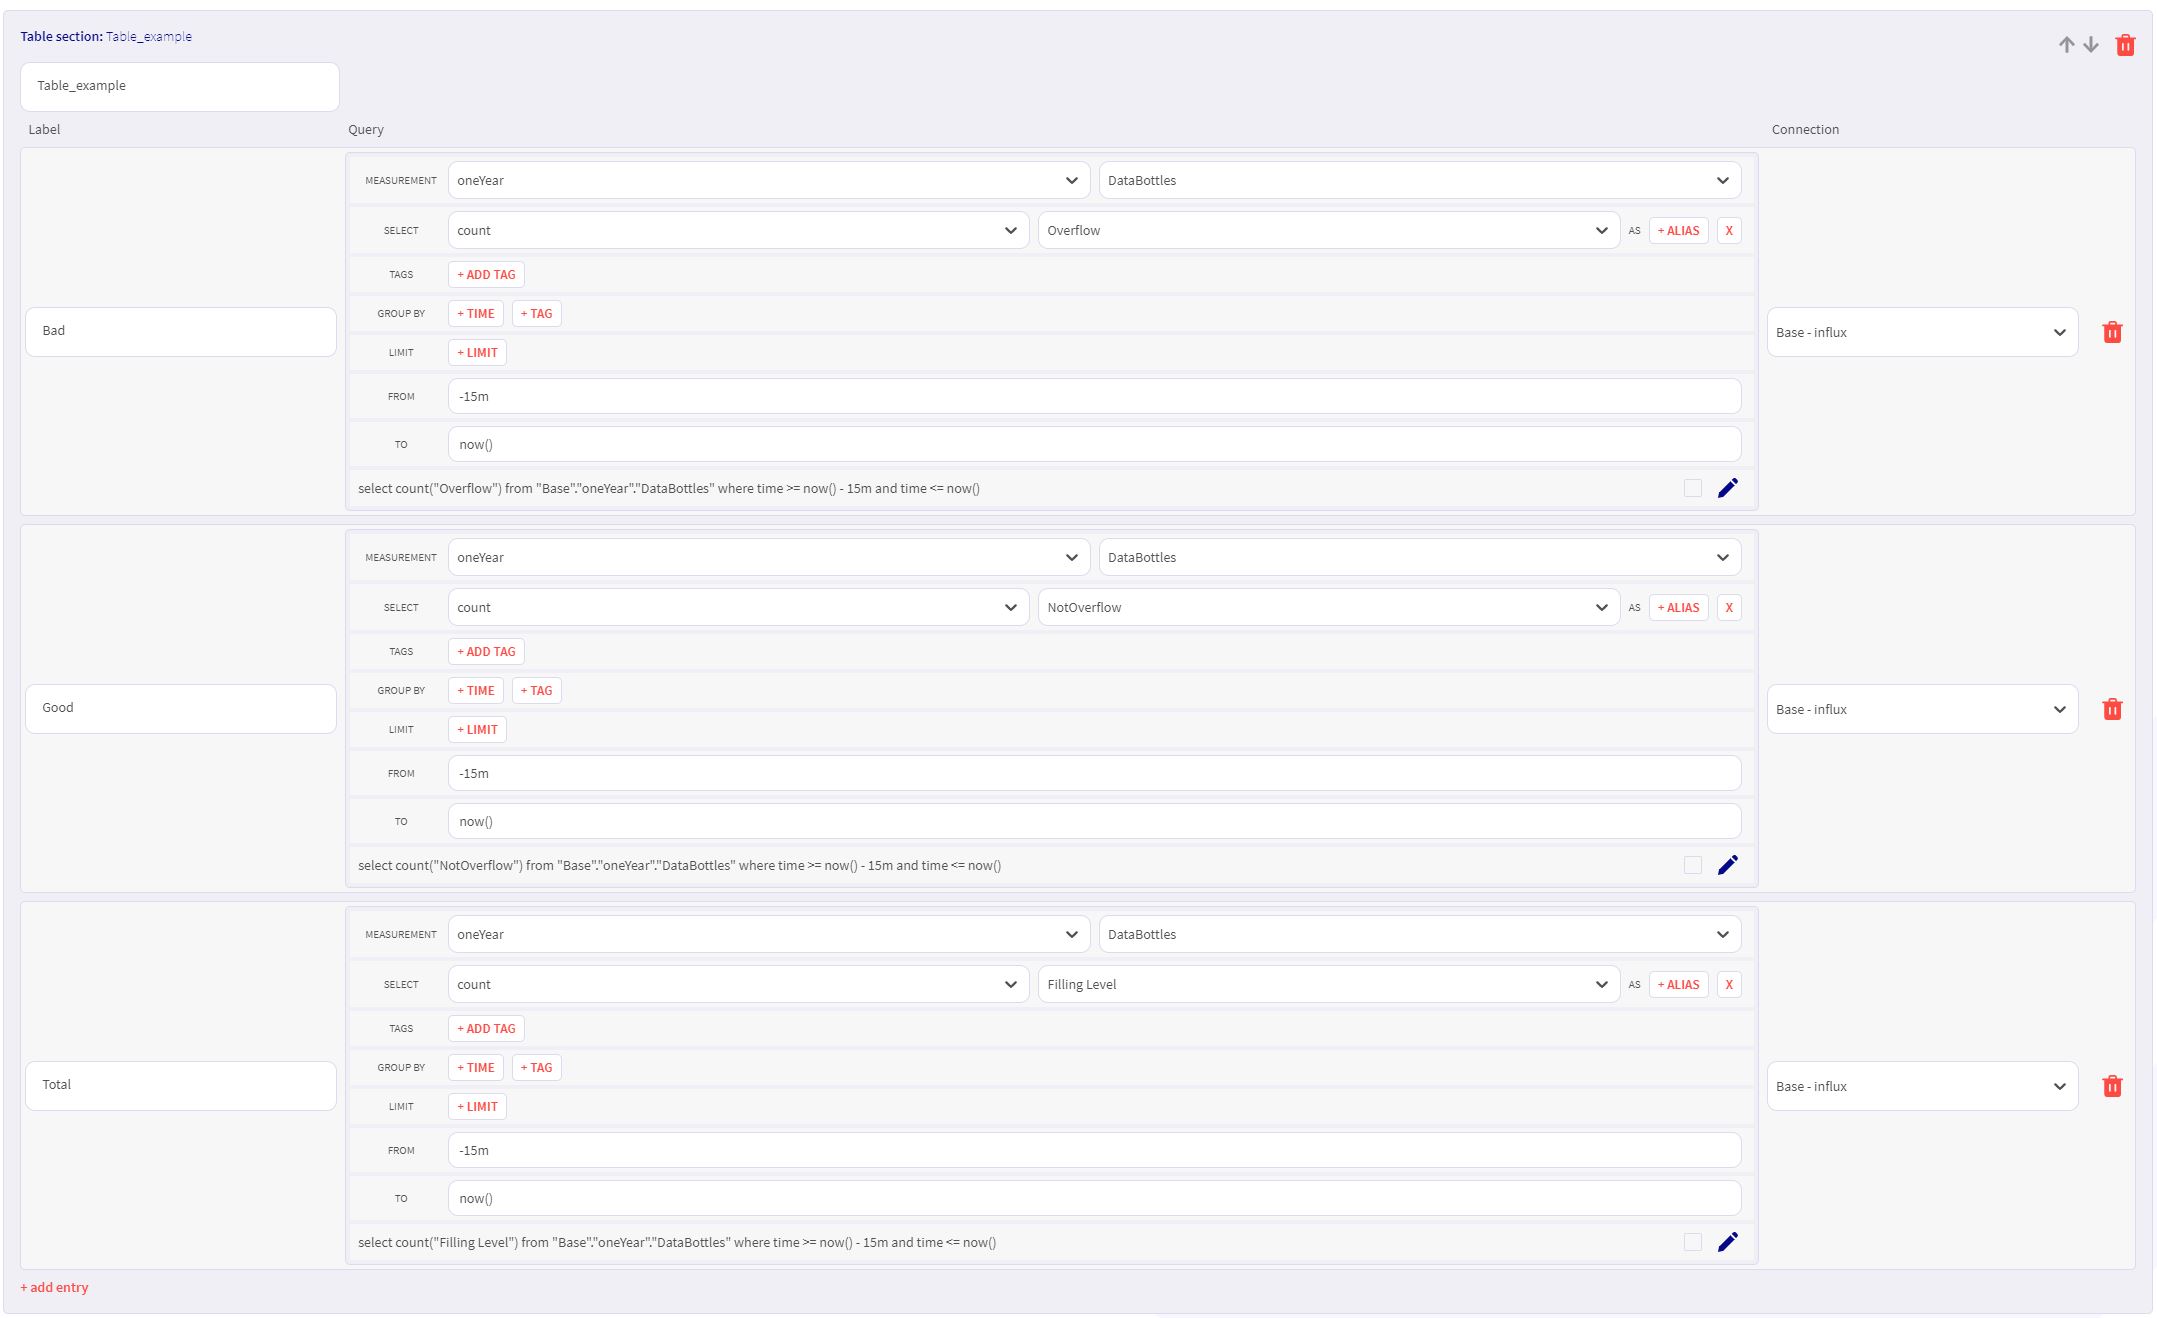
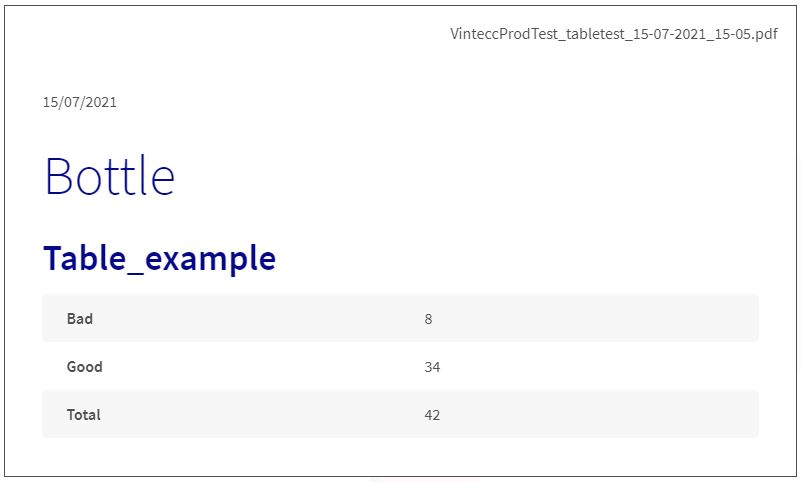
Table
| Field | Function |
|---|---|
| Title | Tite of the section |
| Label | Label of the tabel row |
| Query | InfluxDB query that results in a single value (count, sum, ...) |
| Connection | InfluxDB database to be used on the query |
Example queries
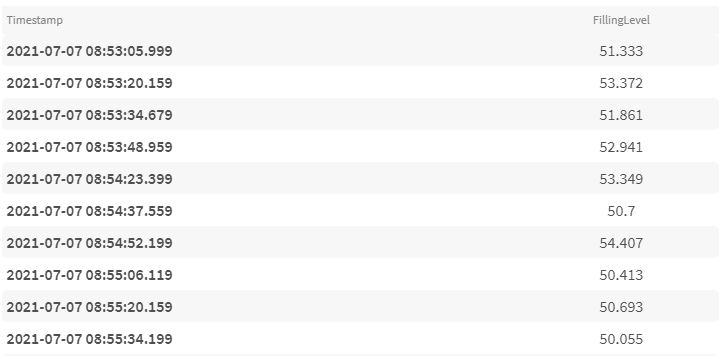
Grid
| Field | Function |
|---|---|
| Title | Title of the grid |
| Connection | InfluxDB database to be used on the query |
| Query | One InfluxDB query with multiple fields possible |
Graph
| Field | Function |
|---|---|
| Title | Title of the section |
| Label | Label of a graph |
| Subtitle | Subtitle of a graph |
| Graph type | Line / Pie / Bar* |
| Connection | InfluxDB database to be used on the query |
| X-axis title | Title of the X-axis on the graph |
| Y-axis title | Title of the Y-axis on the graph |
| Queries | Multiple InfluxDB queries |
- Line chart query should result in a time series response (timestamp, value pair)
- Pie chart query should result in a single value response (count, sum, ...) per query
- Bar chart query should result in a time series response (timestamp, value pair) OR a single value response (count, sum, ...) per query
There is a limit of 1000 points that can be plotted on the graph. If you want to show more data over a longer period of time, add a groupby time in your query
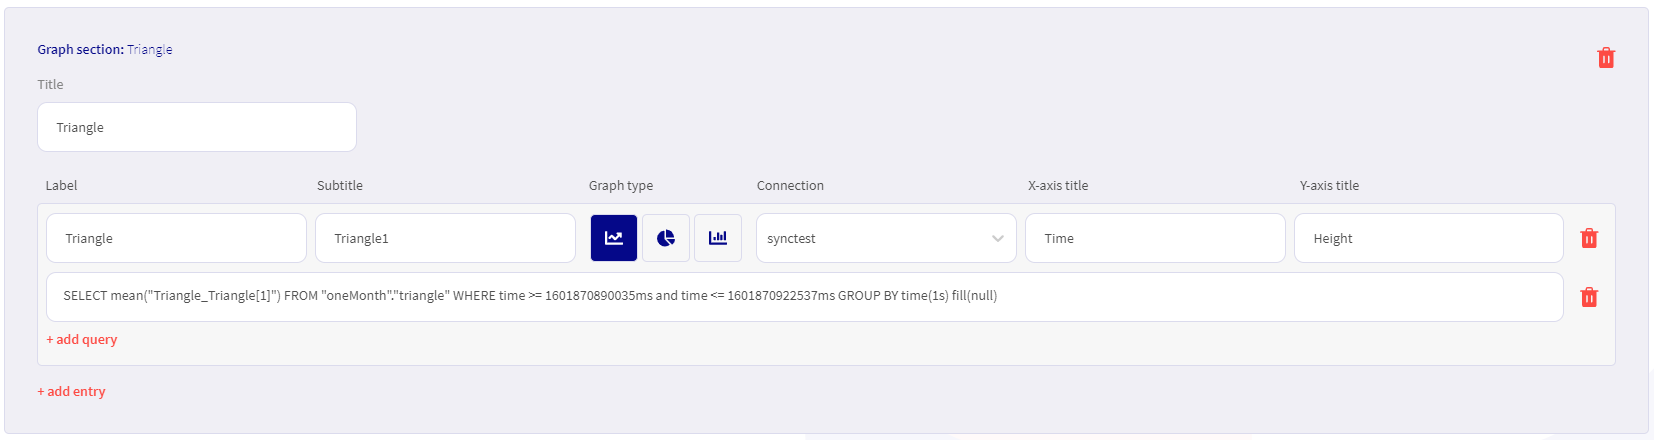
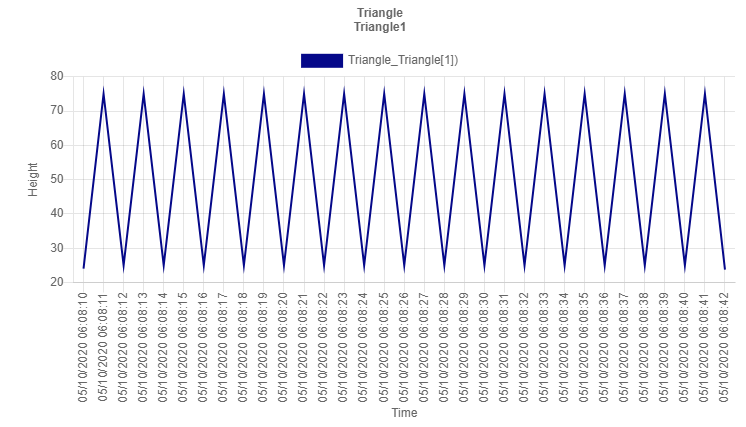
Example Line chart
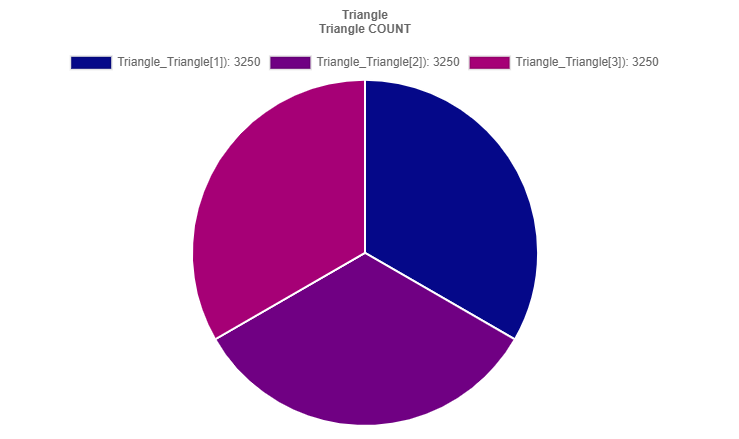
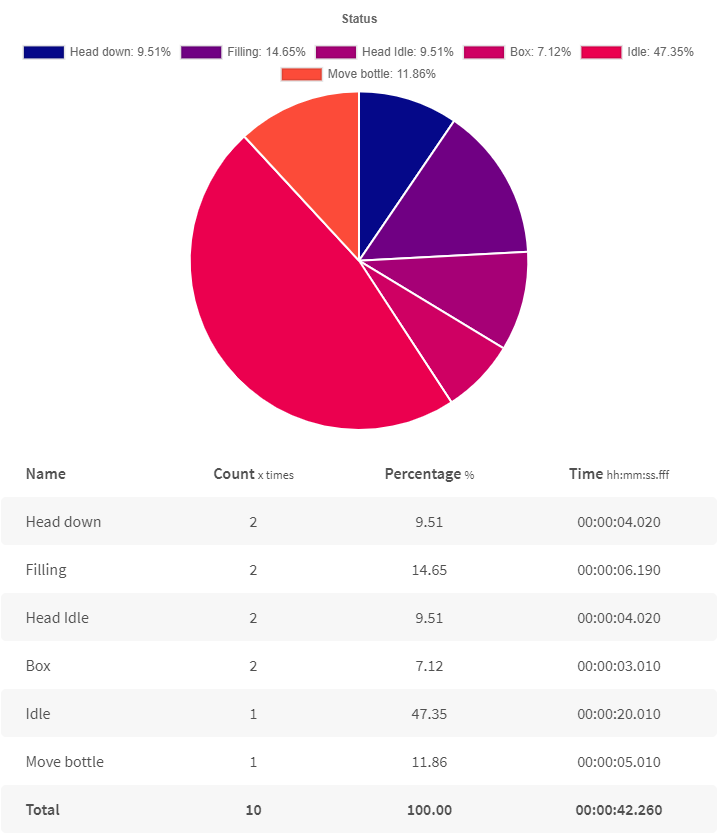
Example Pie chart
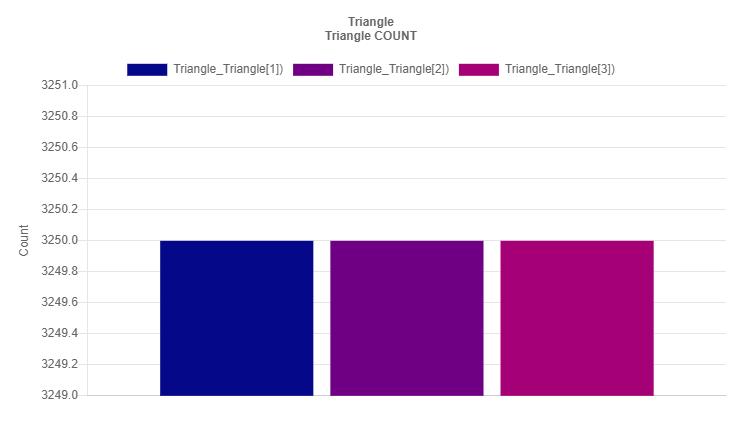
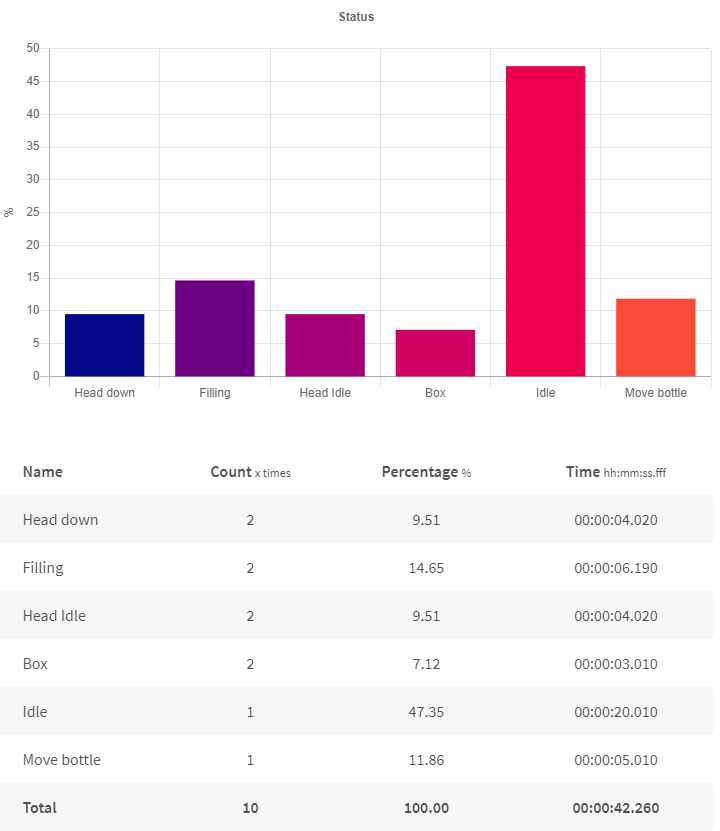
Example Bar chart
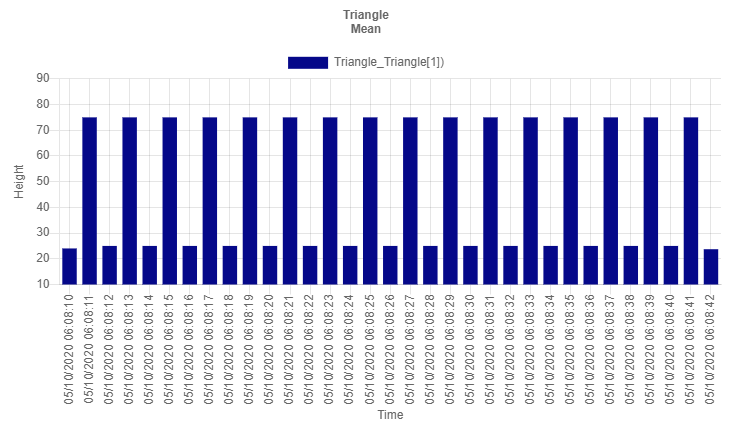
Example Bar chart as time series group by
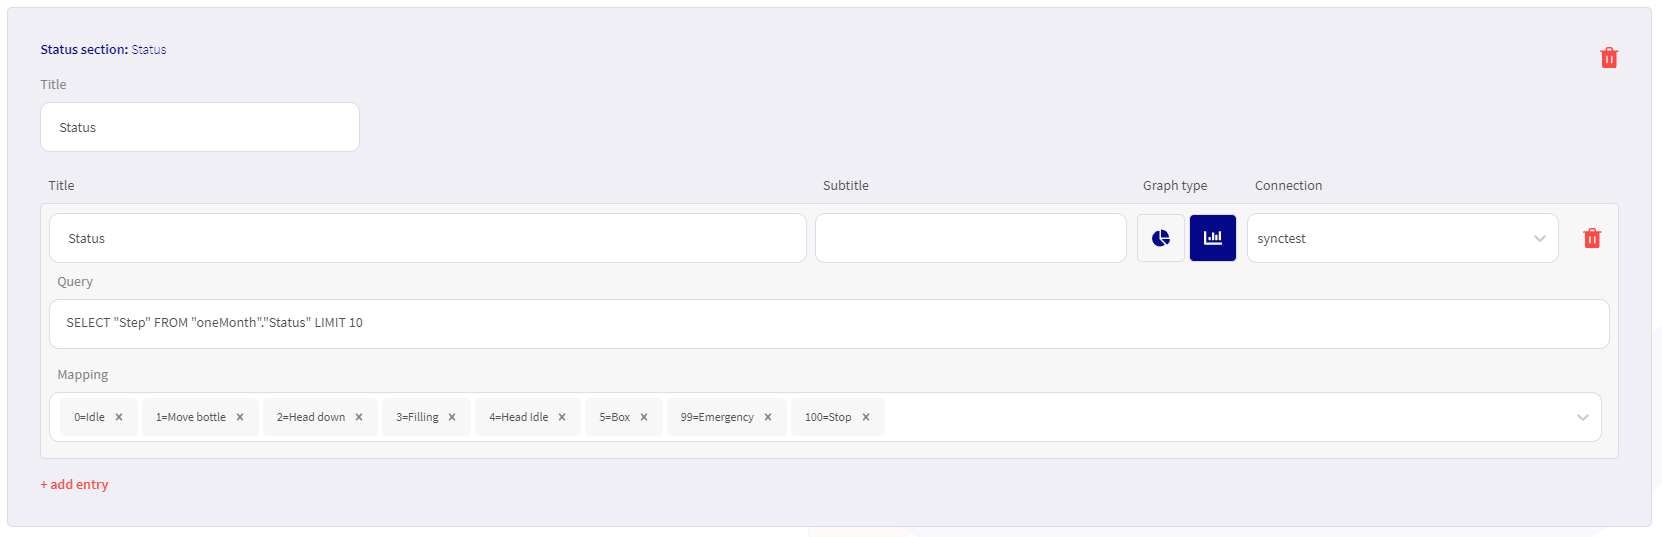
Status panel
| Field | Function |
|---|---|
| Title | Title of the section |
| Title | Title of the graph |
| Subtitle | Subtitle of the graph |
| Query | InfluxDB query that results in a timeseries response (timestamp, value) on a single column name (like Step, ...) |
| Mapping | You can map a value to a label with key=value pairs, these mappings will be used in the graph and table |
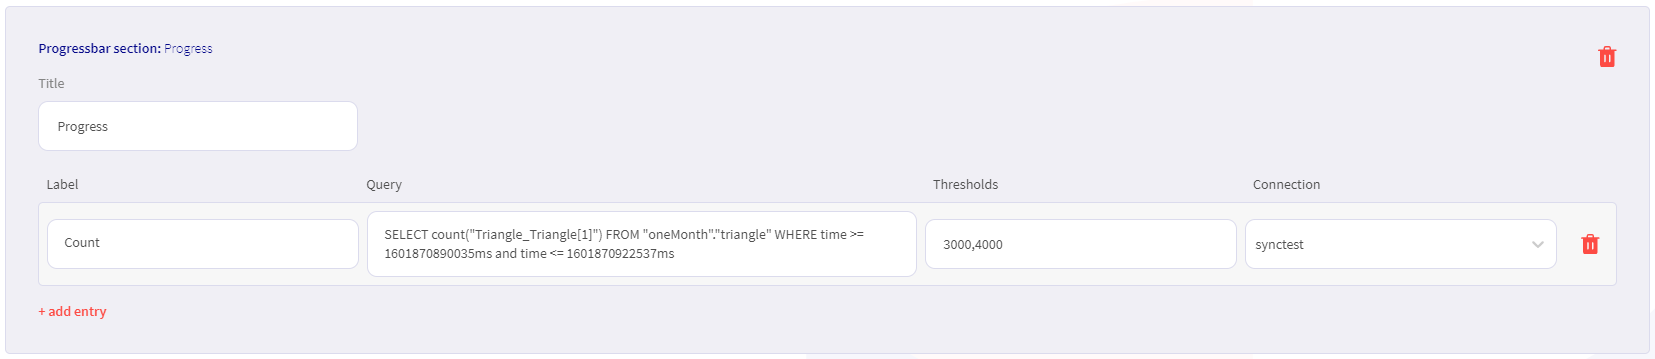
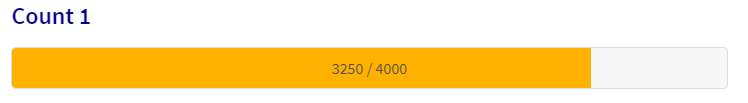
Progress bar
| Field | Function |
|---|---|
| Title | Title of the section |
| Label | Label of the row |
| Query | InfluxDB query that results in a single value (count, sum, ...) |
| Thresholds | Comma seperated value of a medium and max threshold |
| Connection | InfluxDB database to be used on the query |
Grafana panel
How to Get the URL of a Grafana Panel
To find the URL of a specific Grafana panel:
- Navigate to your Grafana Dashboard.
- In the upper-right corner of a panel, click the three dots (menu icon).
- Select the "Share" option.
- Under the "Link" tab, you will see the "Link URL" field.
- Copy the URL from the "Link URL" field and use it in your report panel.
This URL can be used in the report panel of your data platform to link to the Grafana panel.
How the from and to Fields Work
The from and to fields accept relative time expressions that are parsed to determine the start and end of the range. The expressions can use the following components:
- now: Refers to the current time.
- -xd: Refers to
xdays ago. - -xw: Refers to
xweeks ago. - -xM: Refers to
xmonths ago. - -xY: Refers to
xyears ago. - /d, /w, /M, /Y: When combined with the above expressions, the
/specifies the start (beginning) of the given day, week, month, or year. - +Nh, +Nm: Adds additional hours (
h) or minutes (m) to the base time expression to pinpoint exact time ranges.
When using the / symbol, always write now before -...!
The / Symbol for Day-Based Expressions
When the / symbol is used in the from or to fields, it moves the timestamp to the start of that specific day (in the case of from) or the end of that day (in the case of to). This is especially useful when you want to capture a range of data for a specific day or a specific time frame within that day.
Adding Hours or Minutes with /
To capture more specific times (e.g., data between 9:00 and 9:40), you can use the +h (hours) or +m (minutes) syntax. When using these with the / symbol, hours and minutes are added after jumping to the start (for from) or end (for to) of the specified day.
Special Considerations for the to Field
Since the to field uses the end of the day in conjunction with the / symbol, you must subtract an additional day to account for the shift when specifying time ranges with hours and minutes. This can be unintuitive, so here’s how to handle it:
- For the from field: Specify the exact day and time (e.g.,
now-3d/d+9hfor 9 AM three days ago). - For the to field: Specify the previous day when targeting specific times (e.g.,
now-4d/d+580mfor 9:40 AM three days ago).
The from field needs to be longer ago than the to field!
Examples
1: Fetch Data from Today
- from:
now/d - to:
now/d
This will fetch data from the start of the current day (midnight) to the current time.
2: Fetch Data for Yesterday
- from:
now-1d/d - to:
now-1d/d
This will fetch data from the start to the end of yesterday.
3: Data Between 9 AM and 9:40 AM Last Friday Assume today is Monday.
- from:
now-3d/d+9h(This refers to Friday at 9:00 AM) - to:
now-4d/d+580m(This refers to Friday at 9:40 AM)
Explanation:
- In the from field,
now-3d/d+9htakes us to the start of Friday, then adds 9 hours, landing exactly at 9:00 AM. - In the to field,
now-4d/d+580mmoves back 4 days (to Thursday’s end) and then adds 580 minutes, which brings us back to 9:40 AM on Friday.
4: Data for the Last Week
- from:
now-1w/w - to:
now-1w/w
This will capture data from the start of the previous week (Monday) to the end of the previous week.
How it Works
From Field:
- The expression
now-xd/dmoves to the start of the dayxdays ago. Adding+Nhor+Nmmoves forward by hours or minutes.
- The expression
To Field:
- The expression
now-xd/dshifts to the end of the day (23:59:59)xdays ago. Adding+Nhor+Nmsimilarly moves the time forward from midnight.
- The expression
Tags
Tags are not necessary to use in the Capture system, but we strongly recommend making a habit of applying them to your configurations. In reporting, they can be used to seperate reports or report sections for different tag values while using the same configuration. When looking at our bottling example, we have four different bottling machines. We could choose to collect all data from the machines in one report or we could generate one report for each machine.
Generating seperate reports
In the content section of the configurations editor, click + add tag variable. Select the database and choose a tag key, then add the values you want to generate reports for. If you select PDF Key, a different report will be created for each tag value. In our Bottling example, we have a tag that was created in the device configuration named Machine, this has four values (1, 2, 3 and 4) that represent each machine. 
Using tags in the query
While creating a query for the data in a section, you can use tags in a similar fashion as using them in a Grafana query. When clicking + Add Tag, you can select only the data corresponding to that tag value. You can also use tags in the Group By row. 
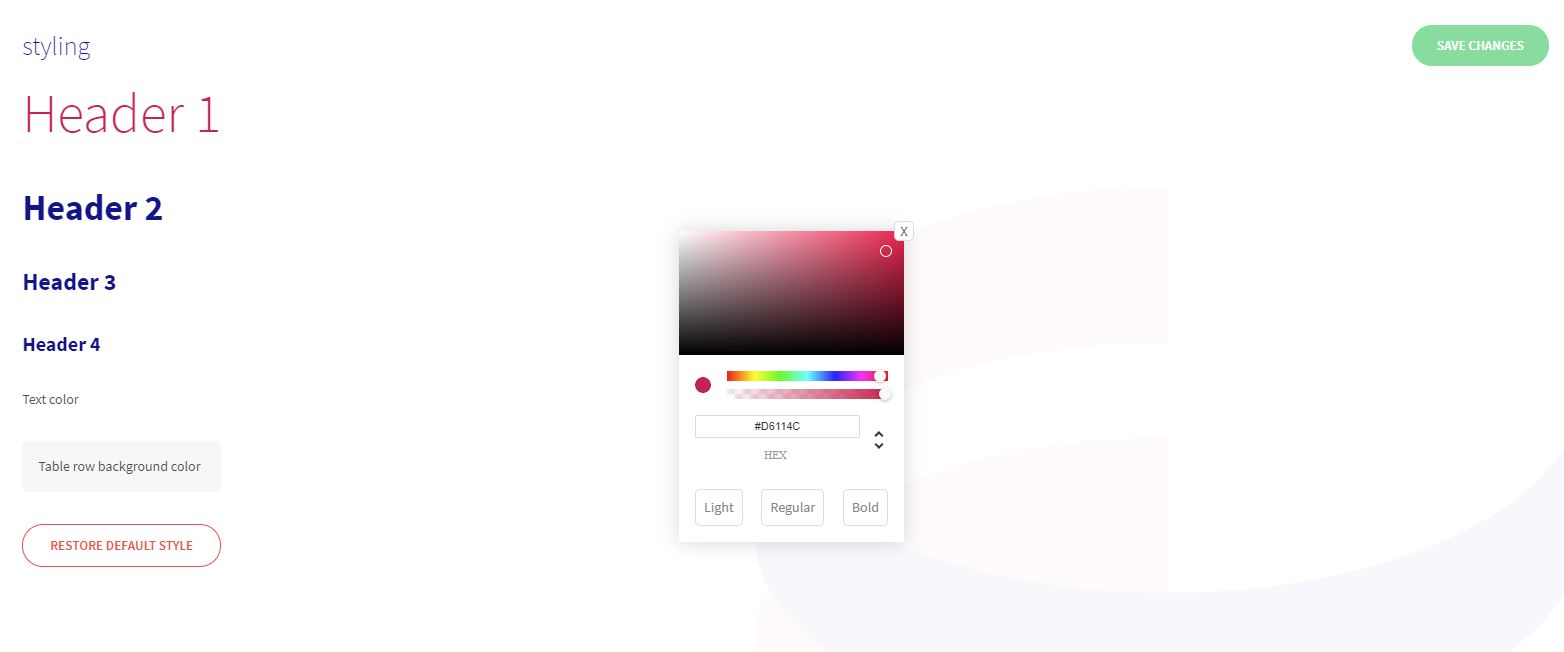
Styling
Customisation options
The colors of the following elements can be customised:
- Header 1
- Header 2
- Header 3
- Header 4
- Text color
- Table row background color
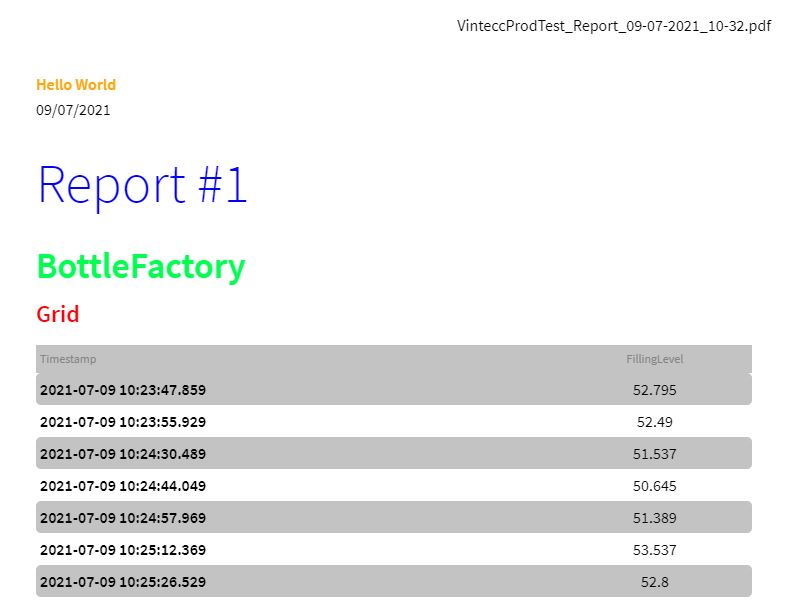
Example
This example should give you a better understanding of each customisable element in the styling section. The settings in this example are:
| Setting | Color |
|---|---|
| Header 1 | Blue |
| Header 2 | Green |
| Header 3 | Red |
| Header 4 | Orange |
| Text color | Black |
| Table row background color | Grey |
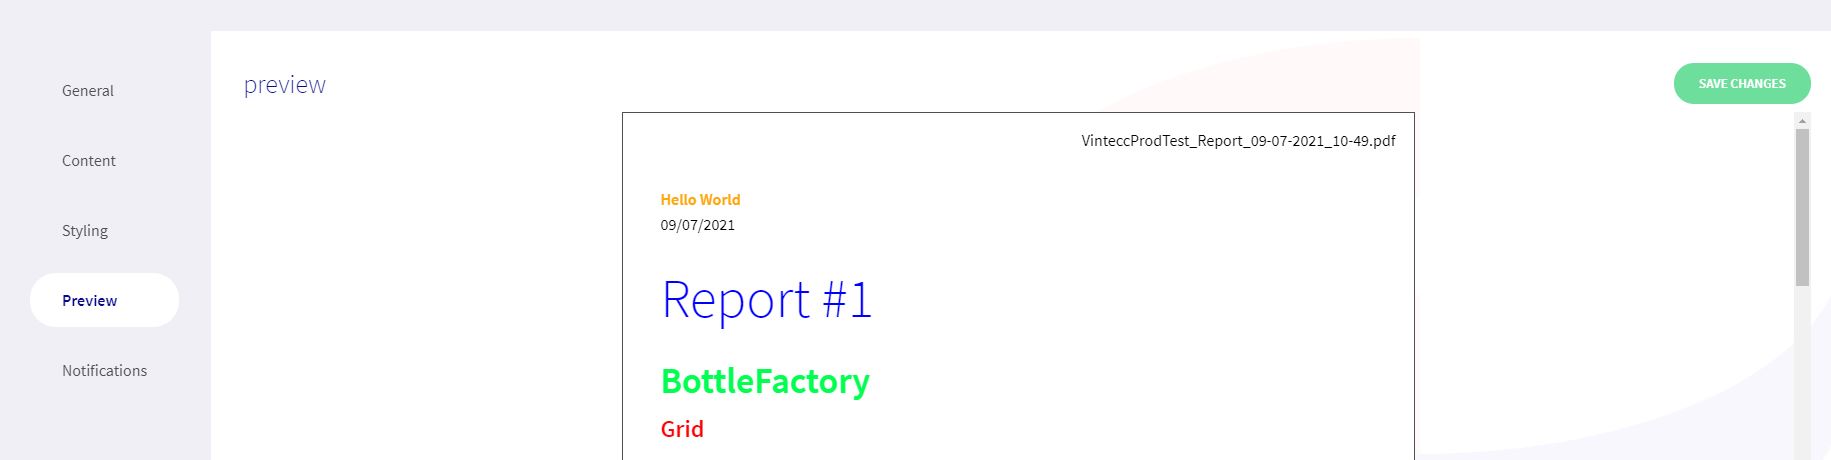
Preview
If you want to take a peek at how the report will look, you can click on "Preview"
Notifications
In this tab, you can select one or multiple team(s). When a new report is generated, it will send an email to every user of the selected team(s). You can add a team by selecting one in the select team tab. When clicking on the Bin Icon, the team will be removed. 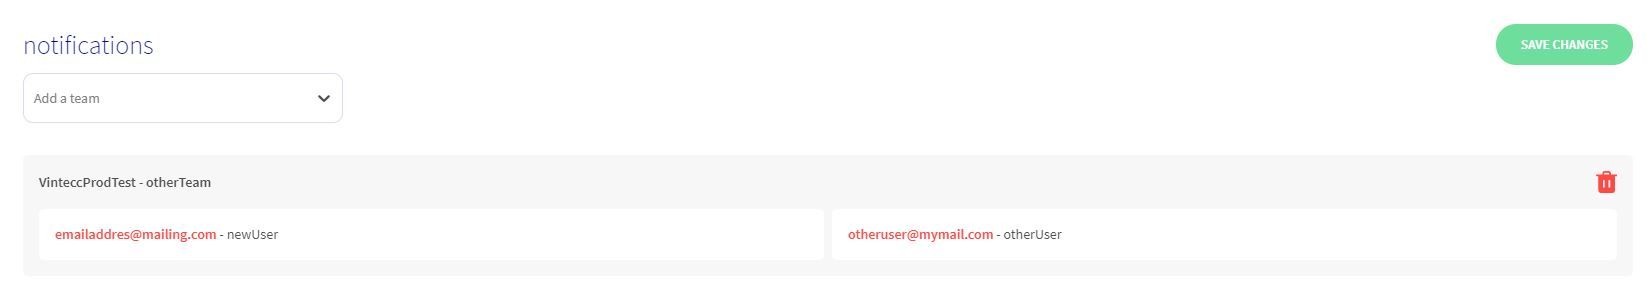
On every generation, each member of the team(s) will receive an e-mail with the report attached: