Create
Creating/editing dashboards
Create a dashboard
To create a dashboard, first go to the Dashboard tab, then:
- Click on the + icon on the left
- Click Add an empty panel
- Select a Data source
- Create a query
- For additional options, check the Grafana documentation
- Click Apply and Save in the top right
Creating a panel
To add a new panel, click on the most left icon of the icon list in the top right. (The Add panel button). Then click Add an empty panel. The following steps are equivalent to the above.
Edit a panel
- Click on the title of the panel
- A dropdown menu will appear, click Edit
- Edit the settings that you want, don't forget to click Save afterwards
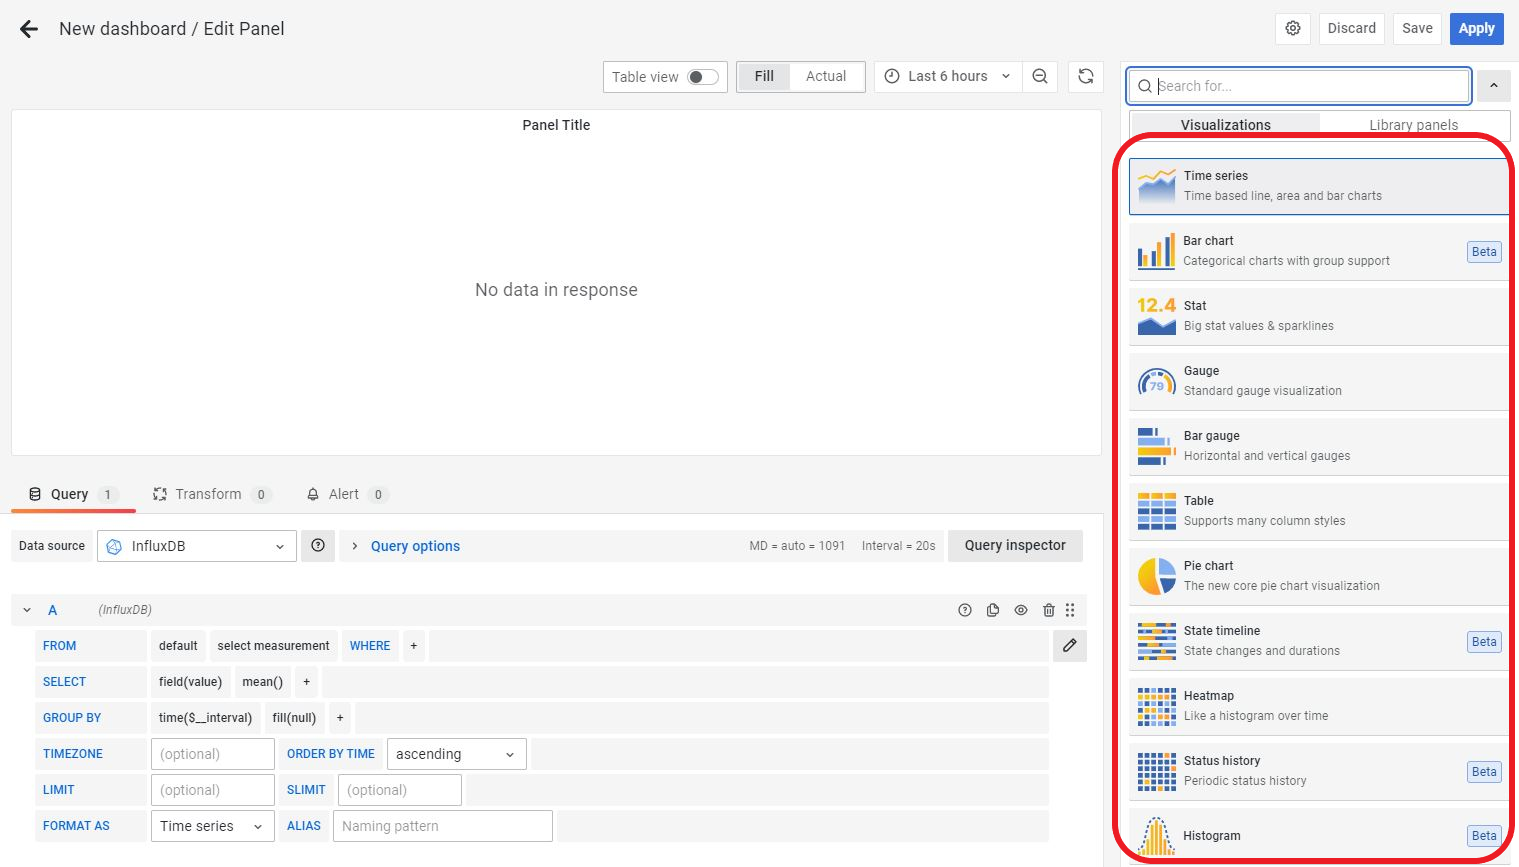
Widget types
When Editing or Creating a Dashboard panel, you can choose between different types of visualisation methods. If you look at the top right of the page, right under the Save button, you'll see the current type that is used in the editor. By clicking on it, you can see a list of all types available. (click on the name of a type to view the detailed grafana support page about it)
- Time series
- Bar chart
- Stat
- Gauge
- Bar gauge
- Table
- Pie chart
- State timeline
- Heatmap
- Status history
- Histogram
- Text
- Alert list
- Singlestat Math
- Progresslist
- StatusMap
- Logs
- SVG
- Multistat
- Discrete
- Plotly
- TrackMap

Best practices
Using rows
With rows, you can group data together. When doing this, you can collapse an entire section so it's not in the way when you want to look at other data. This doesn't only add value to the user friendliness, but it also makes the dashboard faster since it doesn' load the data in collapsed panels. You can add a row by clicking the same button you would to add a new panel, but instead of pressing Add an empty panel, you click Add a new row. Now you can grab an existing panel into this row. When hovering over the row title you can edit some settings (View the grafana docs for more detail).
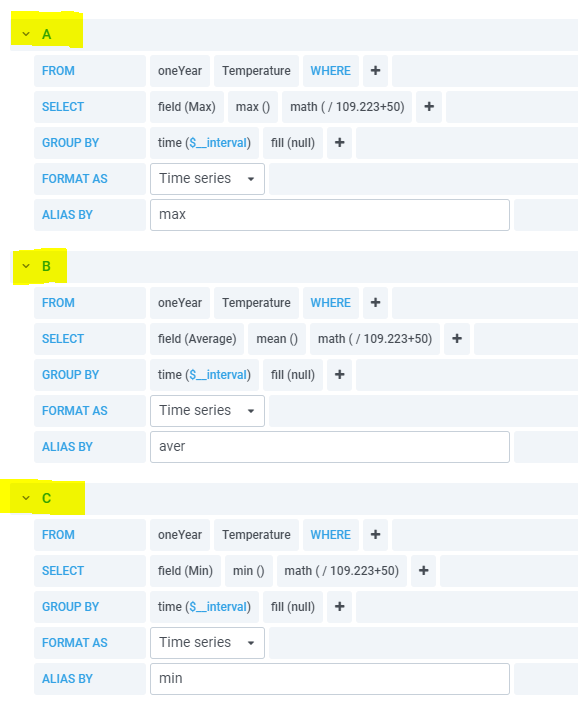
Multiple fields in one query
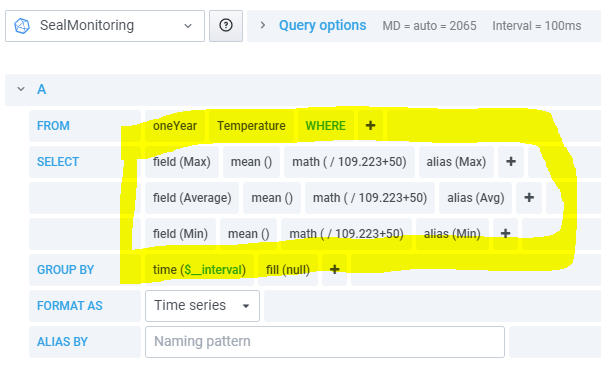
When using different variables from the same meauserement, it is possibe to put them in the same query to improve performance significantly. These two screenshots below show an example of requesting three variables that originate from the same measurement over a large time period (samplerate 1ms).
- In the first image, we use three different queries for these variables, the total execution time to complete this request is 29.86 seconds
- In the second image, we use one query for all three variables, the execution time or this is 13.18 seconds, this is more than twice as fast
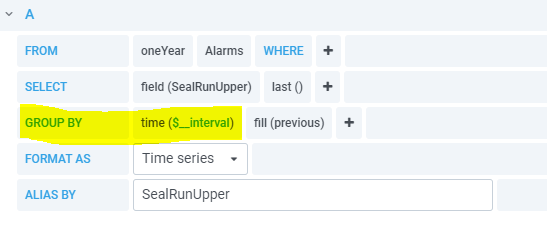
Group by time interval
If you are planning to request a large period of data, it could be very beneficial to use group by time($__interval). The variable $__interval will take the density of the graph into account in combination with the selected time period. This means that there will be fewer datapoints loaded in to make sure there is less cluttering. This also means that the load time will be reduced by a lot.